
All Images
Research News
Placing Landmarks on the Genome Map
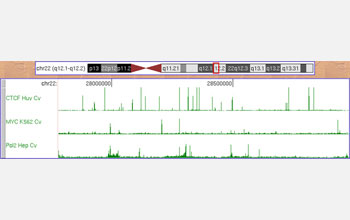
The schematic diagram shows human chromosome 21 with a small region outlined in red. The main rectangle below is a close-up of the outlined region, showing the binding locations of three transcription factors along the chromosome.
Credit: Courtesy of Vishy Iyer
Download the high-resolution JPG version of the image. (59 KB)
Use your mouse to right-click (Mac users may need to Ctrl-click) the link above and choose the option that will save the file or target to your computer.
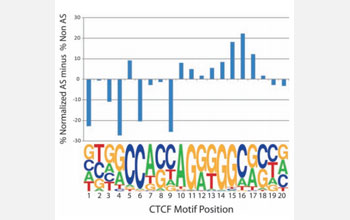
Representation of allele-specific and non-allele-specific single nucleotide polymorphisms (SNPs) across the CTCF binding motif (17). The y-axis indicates the difference between the two as a percentage of normalized total SNPs. Higher bars indicate an increased representation of allele-specific SNPs relative to other positions, which tend to occur at conserved positions.
Credit: McDaniell, R., et al. 2010. Heritable Individual-Specific and Allele-Specific Chromatin Signatures in Humans. Science 328 (5975): 235-239.
Download the high-resolution JPG version of the image. (85 KB)
Use your mouse to right-click (Mac users may need to Ctrl-click) the link above and choose the option that will save the file or target to your computer.