Directorate for Social, Behavioral
and Economic Sciences
NSF 99-329 February 24, 1999
by Lawrence M. Rausch

U.S. inventors lead all other foreign inventors in 7 of the 11 countries examined.
In most parts of the world, foreign inventors account for a much larger share of total patent activity than is the case in the United States.
In 1997, the number of patents granted in the United States again surpassed the number granted the prior year and continued the steady rise in U.S. patent activity that began in 1991. Nearly 112 thousand patents were granted in 1997, of which 55 percent were awarded to U.S. resident inventors. Foreign-origin patents accounted for the remaining 45 percent. Their share rose throughout much of the 1980s before edging downward in 1989. At their peak in 1988, foreign-origin patenting accounted for 48 percent of total U.S. patents.
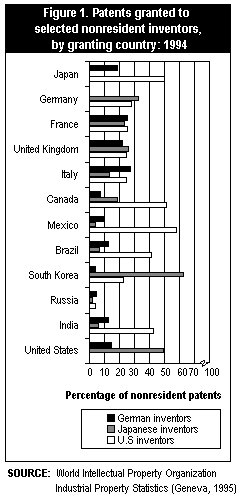
Turning the spotlight around to look at U.S. trends in patenting abroad reveals the success and widespread activity by U.S. inventors. In neighboring Canada and Mexico, U.S. Inventors accounted for more than half of all foreign-origin patents in 1994. An examination of patents awarded to foreign inventors in selected Asian, European, and Latin American nations suggests a widespread demand for U.S. technologies in more distant markets. In 1994, U.S. Inventors accounted for 50 percent of all Japanese patents granted to foreign inventors; 43 percent in India; and 42 percent in Brazil. In the four largest European nations, U.S. inventions represented 28 percent of all foreign patents awarded in Germany and about 25 percent in France, the United Kingdom, and Italy.
Japanese and German inventors also patent widely. German inventors lead all foreign inventors in France, Italy, and Russia; they are also quite active in many of the other countries examined (figure 1). Japanese inventors edge out Americans in Germany and the United Kingdom, and dominate foreign patenting in South Korea. U.S. Inventors lead all other foreign inventors not just in countries neighboring the United States but also in Japan, Brazil, Hong Kong, India, Malaysia, and Thailand.

Patent data provide useful indicators of technology diffusion and can also serve as an indicator-albeit one with certain limitations-of national inventive activities.[1] Due to the greater difficulty and costs associated with gaining patent protection in a foreign country, inventions patented abroad should represent products or processes with market values that justify the time and expense involved. New technical inventions have important economic benefits to a nation, as they can often lead to innovations in terms of new or improved products or more efficient manufacturing processes-or even to new industries. To foster inventive activity, nations assign property rights to inventors in the form of patents that allow the inventor to exclude others from making, using, or selling the invention. Inventors can obtain patents from government-authorized agencies for inventions judged to be new, useful, and non-obvious.
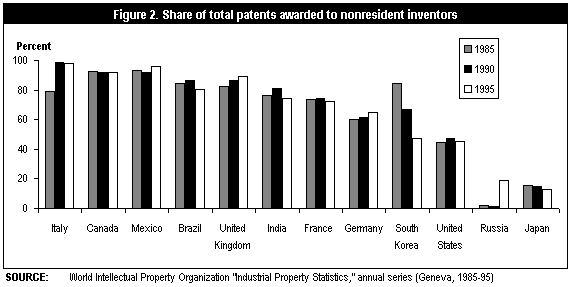
Although nearly half of all U.S. Patents are awarded to foreign inventors, in most parts of the world, foreign inventors account for a much larger share of total patent activity than is the case in the United States. When foreign patent activity in the United States is compared with that in 11 other important countries in 1985, 1990, and again in 1995, only Russia and Japan had less foreign patent activity (figure 2).
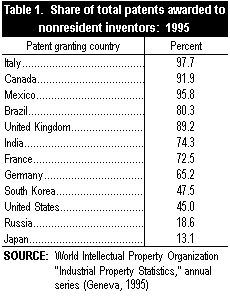
The numerical relationship between resident and foreign patenting can also suggest a nation's openness to, and or need for foreign-developed technologies. Among the 12 nations examined, the level of foreign activity varied widely. Japan had the lowest percentage of patents awarded to foreign inventors (13 percent in 1995): nearly 8 patents were granted to resident inventors for every one awarded to a foreign inventor (table 1). Italy and Mexico had the highest percentages of patents awarded to nonresident inventors-98 percent and 96 percent, respectively. In 1995, South Korea was squarely in the middle of these two extremes, with 48 percent of its patents granted to foreigners. This was not the case five or ten years earlier when resident patenting did not keep pace with foreign patenting. In 1995, South Korea's resident/nonresident patenting ratio at nearly 1:1 was similar to that of the United States.

This Issue Brief was prepared by:
Lawrence M. Rausch
Division of Science Resources Studies
National Science Foundation
4201 Wilson Boulevard, Suite 965
Arlington, VA 22230
703-306-1773 ext. 6927
E-mail: lrausch@nsf.gov
SRS data are available through the World Wide Web (http://www.nsf.gov/statistics/). For more information about obtaining reports, contact pubs@nsf.gov. or call (301) 947-2722. For NSF's Telephonic Device for the Deaf, dial (703) 306-0090. In your request, include the NSF publication number and title, your name, and a complete mailing address.
