Science Resources Studies Division
DATA BRIEF Directorate for
Social, Behavioral
and Economic
Sciences

National Science Foundation
Vol. 1997 No. 4, May 16, 1997

Federal Agencies' Academic S&E Obligations Continued to Climb in FY 1995


By Richard J.
Bennof


Agencies increased their support in five of the six academic S&E funding categories to new current-dollar highs in FY 1995.

Federal agencies reported a 4-percent increase (up nearly 2 percent when measured in constant 1992 dollars) in fiscal year (FY) 1995 obligations for academic science and engineering (S&E) activities, to a record high of $14.3 billion. The increase follows the previous year's (FYs 1993-94) 8-percent growth in total Federal S&E funding. This information is based on the latest statistics from the National Science Foundation's (NSF's) Survey of Federal Science and Engineering Support to Universities, Colleges, and Nonprofit Institutions.

Categories of Support

The six academic S&E funding categories in the Federal S&E Support Survey are: (1) research and development (R&D); (2) fellowships, traineeships, and training grants (FTTG); (3) R&D plant; (4) facilities and equipment for instruction; (5) general support for S&E; and (6) other S&E activities. R&D programs have maintained a consistent dominance of the academic S&E total in recent years (chart 1). About five-sixths of reported academic S&E funds were for R&D programs ($12.1 billion) in FY 1995, up more than 2 percent from the FY 1994 level (a negligible decrease, however, when the 2.5-percent inflation rate is taken into account). Department of Health and Human Services (HHS) projects accounted for more than one-half ($6.5 billion) of all academic R&D obligations.

Each of the other five academic S&E categories showed increased funding levels in FY 1995, and all of them, except "other S&E activities" (its current-dollar record was $992 million in FY 1992), increased to new highs at rates exceeding inflation. The "other S&E activities" category includes all academic S&E activities that cannot meaningfully be assigned to one of the other five categories. FTTG support, up 6 percent in current dollars, rose to $674 million; HHS accounted for the majority of the increase. R&D plant funds grew 56 percent to $335 million, largely from NSF projects funded from the agency's Major Research Equipment and Academic Research Infrastructure accounts. Facilities and equipment for instruction were up 7 percent to $53 million, all of the increase attributable to the Department of Defense (DOD). General support for S&E nearly doubled to $265 million because of more complete reporting from the Agency for International Development (AID). General support for S&E includes activities that provide support for nonspecific or generalized purposes related to scientific research and education.

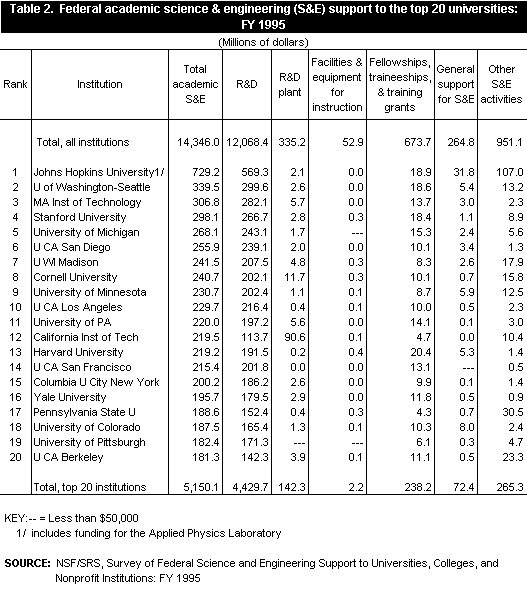
The leading 20 universities accounted for 36 percent of the academic S&E total.

Agency Sources

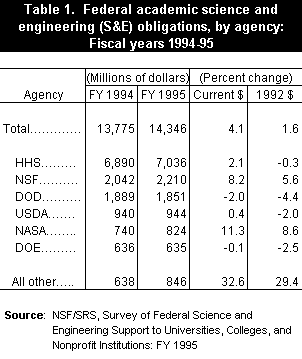
Of the six Federal agencies that accounted for the largest amounts of academic S&E support in FY 1995 (collectively providing 94 percent of the total), four-HHS, NSF, the Department of Agriculture (USDA), and the National Aeronautics and Space Administration (NASA)-reported current-dollar increases (table 1). However, when adjusted for inflation, only NASA and NSF showed increases (9 percent and 6 percent, respectively in 1992 dollars). Nearly three-fourths of the NASA increase was for R&D projects and more than three-fifths of the NSF increase was for R&D plant support.

University Shares

Johns Hopkins University (including its Applied Physics Laboratory) was the leading university recipient of Federal S&E support in FY 1995 (table 2). Nearly four-fifths of its $729 million total was for R&D programs and most of the remainder was for "other S&E activities." The leading 20 universities, ranked by the amount of Federal academic S&E support they received, accounted for 36 percent of the academic S&E total. Eighteen of the top 20 academic S&E recipients in FY 1995 were among the leading 20 recipients in FY 1994. The new entrants for FY 1995 were the California Institute of Technology (twelfth) and the University of Pittsburgh (nineteenth). Cal Tech, previously ranked thirty-first, received about double its FY 1994 S&E obligation level, primarily as a result of increased NSF R&D and R&D plant support. The University of Pittsburgh was previously ranked twenty-third in S&E support. The five leading universities in FY 1994 maintained the same ordinal positions in FY 1995.

User Notes

The Federal S&E Support data presented in this Data Brief were obtained from the 15 Federal agencies that provide virtually all academic R&D support and that participated in the FY 1995 Survey of Federal Science and Engineering Support to Universities, Colleges, and Nonprofit Institutions. The annual survey also includes statistics on Federal S&E obligations by funding category, type of institution, institutional ranking, and geographic distribution.

NSF also makes available computer-generated Institutional Profiles for individual doctorate-granting institutions and schools with S&E departments that grant a master's degree. Institutional Profiles contain data from this survey and from NSF's other two academic S&E surveys: the Survey of Research and Development Expenditures at Universities and Colleges and the Survey of Graduate Science and Engineering Students and Postdoctorates. Data from these three surveys also are available via the world wide web (see "Electronic Dissemination," p.1) and the Computer-Aided Science Policy Analysis and Research (CASPAR) database system, a user-friendly tool on CD-ROM for retrieval and analyses of statistical data on academic S&E resources.

This Data Brief was prepared by:

Richard J. Bennof
National Science Foundation
Division of Science Resources Studies
4201 Wilson Boulevard
Suite 965
Arlington, VA 22230

For free copies of SRS Data Briefs, write to the above address, call 703-306-1773, or send e-mail to pubs@nsf.gov.


previous arrow up arrow