|
Division of Science Resources Studies
|
|
 |
Directorate for
Social, Behavioral and Economic Sciences |
|
|
|
|
National Science Foundation
|
NSF 00-323, June 22, 2000
|
Top 100 R&D-Performing Academic Institutions Continue Increased Facilities Construction
Leslie Christovich
Amount of S&E research space at the top 100 R&D-performing institutions has grown steadily over the past decade.
The percentage of the top 100 institutions classifying their space as suitable for the most scientifically competitive research has increased since 1988.
Total research space in science and engineering (S&E) fields at the top 100 research and development (R&D)-performing universities and colleges in the U.S. continued to increase in 1998. This increase follows steady increases from 81 million net assignable square feet (NASF) in 1988 to 101 million NASF in 1998.
At the same time, the percentage of top 100 institutions reporting inadequate amounts of space in each S&E field has increased to the highest levels since 1988. The top 100 institutions also report the highest percentage (39 percent) since 1988 of their research space as suitable for use in the most scientifically sophisticated research. Details of the status of S&E research facilities at the top 100 R&D-performing academic institutions, doctorate-granting academic institutions other than the top 100 institutions, nondoctorate-granting institutions, and Historically Black Colleges and Universities (HBCUs) will be available soon in the National Science Foundation's (NSF's) report, Scientific and Engineering Research Facilities at Colleges and Universities: 1998.
In 1998, the nation's top 100 academic institutions in R&D expenditures had 101 million net assignable square feet of research space in science and engineering fields. This constituted about 71 percent of the total S&E research NASF (143 million NASF) at the nation's entire 660 R&D-performing academic institutions. The amount of S&E research space at the top 100 institutions has grown steadily over the past decade (from 81 million NASF in 1988), while their share of the nation's total research NASF has remained stable.
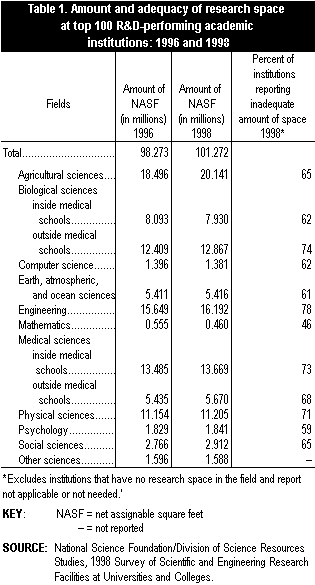
The majority of the research space at the top 100 institutions was assigned to 10 science and engineering fields (table 1). Ninety-four of the top 100 institutions had S&E research space in the field of non-medical school biological sciences, whereas 40 had research space in the agricultural sciences. In 1998, the largest amount of research NASF was in the agricultural sciences (20 million), engineering (16 million), the medical sciences located in medical schools (14 million), the non-medical school biological sciences (13 million), and the physical sciences (11 million) (table 1).
Adequacy of Research Space
Ninety-two of the top 100 institutions reported that their institution had an inadequate amount of research space to meet their current research commitments in 1998. On average, they estimated that they needed approximately 18 percent more space than currently existed in order to meet these commitments. However, at the same time, sixty-eight institutions deferred the planned (i.e., included in an institutional plan) construction and repair/renovation of their existing facilities because the projects were not funded.
The lowest percent of institutions (46 percent) reporting a deficit in research space was in mathematics while in all other fields more than fifty percent of the institutions reported deficits ranging from 59 percent to 78 percent (table 1). Except for agriculture, the fields in which the highest number of institutions reported space shortages (engineering, non-medical school biological sciences, medical sciences in medical schools and the physical sciences) were also the fields that currently have the greatest amount of research space. In 1996, the greatest proportion of institutions also reported deficits in three of these same four fields: engineering, the non-medical school biological sciences, and the physical sciences. There were significant increases from 1996 in the percent of institutions reporting inadequate space in every S&E field. The largest increase was 35 percentage points in the agricultural sciences.
Across all S&E fields except for the biological sciences in medical schools and the earth, atmospheric and ocean sciences, a greater percentage of the top 100 institutions reported inadequate research space than was reported by the doctorate-granting institutions that were not among the top 100. In addition, except for the earth, atmospheric and ocean sciences, a larger percentage of the top 100 institutions reported inadequate research space across all S&E fields than was reported by those institutions granting solely master's and bachelor's degrees in S&E and having more than $50,000 in annual R&D expenditures.
Condition of the Research Space
In addition to reporting the need for more space, the top 100 institutions also reported that 24 percent of their existing research facilities needed either major renovation or replacement. By comparison, other doctorate-granting institutions not in the top 100 reported that 19 percent of their facilities required renovation or replacement. Nondoctorate-granting institutions reported that 31 percent of their facilities were in such need.
At the same time, the top 100 institutions stated that 39 percent of their research space was suitable for the most scientifically competitive research in the field. The percent of research space classified by the top 100 institutions as suitable for the most scientifically competitive research (the category of highest quality) has generally been increasing since 1988, from about 24 percent of the research space in 1988 to 39 percent of the research space in 1998.
Future Research Facilities
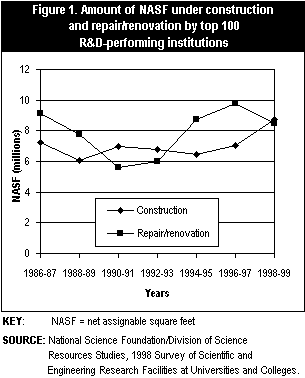
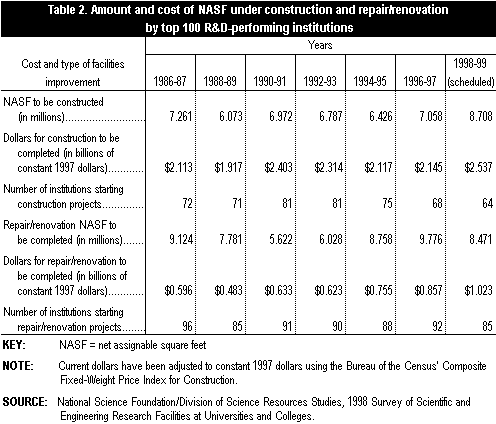
The top 100 institutions scheduled new construction of 9 million NASF in research space in 1998-99, a 23 percent increase over the amount of new construction begun in 1996-97 (7 million NASF). Since 1994-95, these institutions have been increasing the amounts of new research space construction started (Figure 1). Prior to 1994-95, there were several years of decline in the amount of new construction at both the top 100 and other doctorate-granting institutions. Therefore, no real trend appears over the years because the amount of research space under construction has varied between increases and decreases. Since 1994-95, the number of top 100 institutions starting new construction has been decreasing while the amount of square footage to be constructed and the associated costs have been increasing (table 2).
In 1996-97, the amount of new research space construction started by the top 100 institutions was more than double the amount of new research space construction started at other doctorate-granting institutions (3 million) and almost six times the amount of new space construction begun at nondoctorate-granting institutions (1 million). Although the amount of funds for the new construction at other doctorate-granting institutions increased dramatically between 1994-95 and 1996-97 (from $430 million to $789 million), the amount of funding for new construction at the top 100 remained essentially flat between these two time periods.
The amount of new NASF construction at the top 100 institutions contrasts with the amount of new NASF repair or renovation. After three consecutive two-year periods of increases in the amount of square footage being repaired, the top 100 institutions have scheduled a decrease in new repair or renovation to 8 million NASF in 1998-99 (Figure 1).
This Data Brief was prepared by:
Leslie Christovich
Division of Science Resources Studies
National Science Foundation
4201 Wilson Boulevard, Suite 965
Arlington, VA 22230
703-306-1775 x 6910
lchristo@nsf.gov


