|
Division of Science Resources Studies
|
|
 |
Directorate for
Social, Behavioral and Economic Sciences |
|
|
|
|
National Science Foundation
|
NSF 00-320, April 28, 2000
|
U.S. Industrial R&D Performers Report Increased R&D in 1998
Raymond M. Wolfe
Company funding of industrial R&D increased, as it has each year since 1953, to $169.2 billion in 1998.
R&D-performing industries reported $4.7 trillion in sales in 1998.
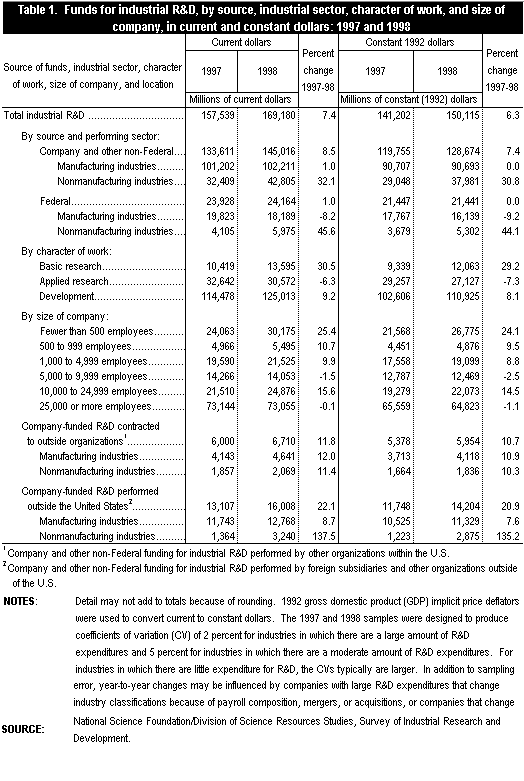
The National Science Foundation’s (NSF’s) 1998 Survey of Industrial Research and Development shows that companies[1] spent $169.2 billion on research and development (R&D) that they performed in the United States, 7 percent more than the amount spent during 1997. Company funding[2] continued to increase, as it has each year since 1953, rising from $133.6 billion in 1997 to $145.0 billion in 1998, a 9-percent increase. Federal funding of industrial R&D in 1998 was $24.2 billion—basically unchanged from the 1997 total of $23.9 billion. After adjusting for inflation, total R&D rose 6 percent, company-funded industrial R&D rose 7 percent, and federally funded industrial R&D stayed level. Summary statistics from the 1997 and 1998 surveys are compared in table 1.
Sales of R&D-Performing Industries
Domestic net sales[3] of companies that performed R&D in the United States were essentially unchanged, $4.6 trillion in 1997 and $4.7 trillion in 1998. Similarly, manufacturers’ sales were $3.1 trillion and $3.2 trillion; companies in nonmanufacturing industries reported sales of $1.49 trillion and $1.46 trillion, respectively. Indicated below are domestic sales figures for manufacturing industries that performed the most industrial R&D using company funds during 1998 (company-funded R&D amounts are indicated in parentheses).
- motor vehicles $603.0 billion ($13.5 billion);
- drugs and medicines $118.4 billion ($12.6 billion);
- communication equipment $91.1 billion ($10.2 billion);
- electronic components $115.8 billion ($9.8 billion);
- professional and scientific instruments $121.0 billion ($9.6 billion);
- office, computing, and accounting machines $96.2 billion ($8.9 billion).
Sales figures for top performing nonmanufacturing industries of company-funded R&D are indicated below (company-funded R&D amounts are indicated in parentheses).
- computer and data processing services $114.9 billion ($14.3 billion);
- trade $313.8 billion ($11.3 billion);
- research, development, and testing $13.3 billion ($6.8 billion);
- telephone communications $193.6 billion ($1.7 billion);
- finance, insurance, and real estate $370.8 billion ($1.6 billion);
- health services $14.0 billion ($1.2 billion).
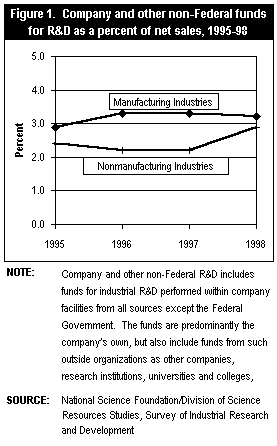
The amount of company funds spent by manufacturing and nonmanufacturing industries on the performance of R&D expressed as a percent of net sales during 1995-98 is illustrated in figure 1.
Notes on Survey Methodology and Future Surveys
Statistics resulting from the 1998 survey benefit from recent efforts to strengthen statistics for industries that perform the greatest amounts of R&D while lessening coverage of industries that perform little or no R&D. Specifically, a new sampling approach was used for companies in industries that do not conduct significant amounts of R&D. These companies were sampled at much lower rates than in previous surveys. This has shifted more emphasis toward those industries crucial in developing strong, representative estimates of industrial R&D spending. This sampling approach and its effect on the resulting statistics are discussed in detail in the latest annual report, Research and Development in Industry: 1997 (NSF 99-358) at http://www.nsf.gov/statistics/nsf99358/, and in the forthcoming Research and Development in Industry: 1998.
Preparation is under way for conversion to the new North American Industrial Classification System (NAICS) from the Standard Industrial Classification (SIC) system currently used for many industry-related economic statistics produced by the Federal Government. Statistics in this Data Brief, as well as all of the statistics produced from the Survey of Industrial Research and Development, are classified using SIC codes. Plans are being made to publish survey statistics using NAICS beginning with the results from the 1999 survey. For that year, NSF intends to publish some statistics classified by both the SIC and NAICS industry codes. Beginning with the 2000 survey, statistics will be published only with NAICS classifications.
Statistical Reports
This Data Brief provides statistics and information from the 1998 Survey of Industrial Research and Development. The annual report, Research and Development in Industry: 1998, will contain the full set of 56 tables available from the survey. The tables will present R&D statistics by industry, size of company, source of funds, character of R&D, R&D as a percentage of net sales, and R&D contracted to outside organizations and performed outside the United States. The report also will provide historical trends in R&D, sales and total employment of R&D-performing companies, employment of R&D scientists and engineers, statistics by state, and technical information on the survey sample and processing.This Data Brief was prepared by:
Raymond M. Wolfe
Division of Science Resources Studies
National Science Foundation
4201 Wilson Boulevard, Suite 965
Arlington, VA 22230
703-306-1772 x6936
rwolfe@nsf.gov

