- Select a topic
-
 Higher
Education -
 Workforce
-
 International
Mobility

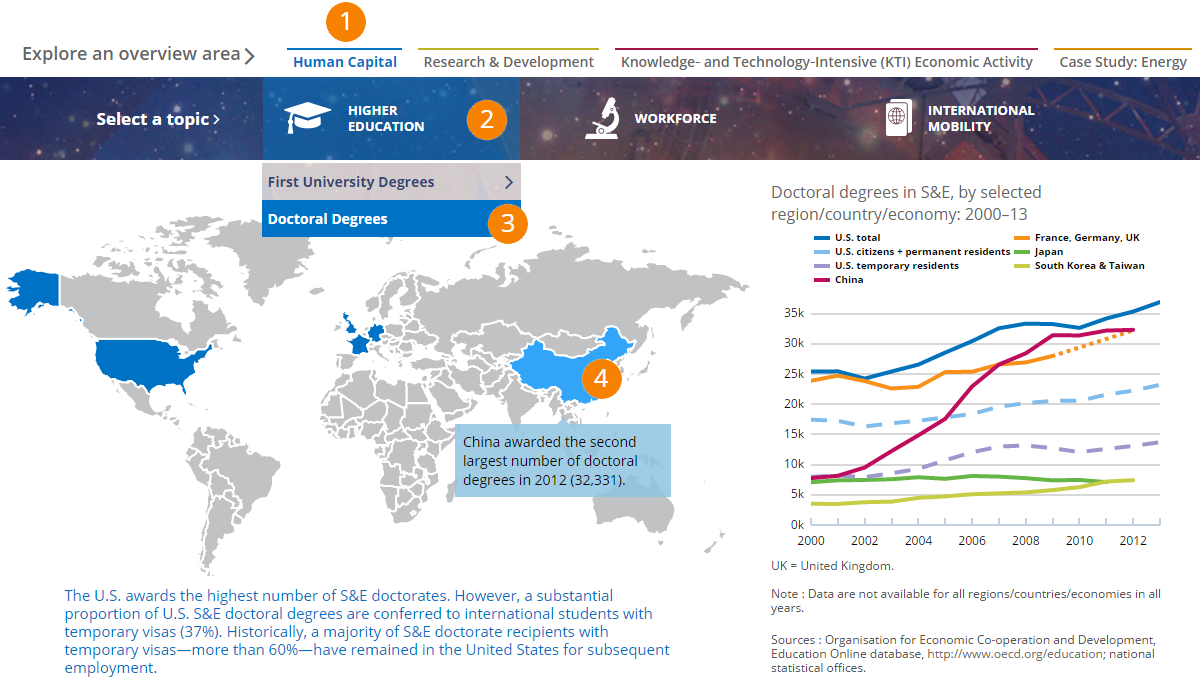
In today’s knowledge‐ and technology‐intensive economies, human capital is critical to a nation’s innovative capacity and economic competitiveness. Recognizing this, governments in many countries have made access to post-secondary Science and Engineering (S&E) education a high priority. The result has been the creation of a truly global landscape for S&E tertiary education. Finding globally comparative ways to measure S&E workforce is challenging, but a comparison of researchers provides one reliable measure. Here, too, we see growth in traditional centers like the United States and Europe but also in parts of Asia. In terms of both education and workforce, we are also seeing increased international mobility of S&E students and workers.
You can explore this topic further in Science and Engineering Indicators 2016:

R&D investment indicators are an important measure of a nation’s Science and Technology (S&T) enterprise and are critical to economic competitiveness in knowledge‐ and technology‐intensive economies. Between 2003 and 2013, the worldwide total of R&D expenditures doubled. Along with this, an increasingly multipolar world for R&D emerged as China, South Korea, and Israel made significant investments and took their place alongside the traditional R&D leaders — the United States, Europe, and Japan. However, even as more countries engage in R&D there remain significant variations in the rate of R&D growth, in the relative focus on early versus later stages of R&D, in the proportion of business sector investment, and in their areas of concentration. Research and patents are two tangible, internationally comparable measures of R&D output.
You can explore this topic further in Science and Engineering Indicators 2016:

New knowledge from R&D translates into more than articles, patents, and intangibles. With time, its outcomes become a visible part of economic activity in the form of products, services, and processes. KTI industries that rely on new knowledge, technological advances, and skilled workers span both the manufacturing and services sectors. These industries typically make up a larger percentage of GDP in developed countries than in developing countries.
You can explore this topic further in Science and Engineering Indicators 2016:

Many science and engineering (S&E) activities address important societal issues, such as meeting the world’s energy needs. These S&E activities are closely linked to R&D, are often global in scope, and involve both developed and developing nations. The U.S. and the EU, for example, have efforts that are more focused on research and knowledge production, whereas China continues to concentrate on later-stage commercial production. Global public and private sector activity aimed at generating alternative and affordable energy includes financing, research, patenting, and production in the areas of biofuels, solar, wind, energy efficiency, pollution prevention, smart grid, and carbon sequestration.
You can explore this topic further in Science and Engineering Indicators 2016:

In recent years, different regional growth trends have produced dramatic shifts in the global landscape of science and engineering (S&E) research and development, education, and business activities. The result is that an increasingly multipolar world for S&E has now emerged after many decades of S&E dominance by the United States, Western Europe, and Japan. This interactive infographic invites detailed exploration of the changing landscape of global S&E along a number of key dimensions: higher education degree production, R&D investment, high-tech manufacturing and knowledge-intensive services, and public and commercial investment in clean energy. This infographic uses the authoritative data and analyses from the 2016 edition of the National Science Board’s Science & Engineering Indicators report.
- Select an overview area tab. Topic areas will appear underneath the tab.
- Select a topic area. Figure titles within the topic area will appear.
- Select a figure title to view related data.
- Select a highlighted region for summary data.
- Press “Alt” to display the IE menu.
- Choose Tools | Compatibility View settings
- Remove the checkmark next to Display intranet sites in Compatibility View.
- Choose Close.