
Multimedia Gallery
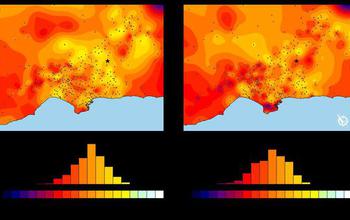
A chart compares SCEC simulations to observations from the 2008 Chino Hills earthquake.
These two Los Angeles area maps compare ground motions calculated by SCEC earthquake simulations to ground motions observed during the 2008 Chino Hills earthquake. On each map, the star marks the quake's epicenter, and the dots show locations where ground motions were recorded for that earthquake. The color variations show how well the simulated ground motions match the observed ground motions, with darker colors (from red to black) indicating areas with poorer matches and lighter colors (from yellow to white) indicating areas with good matches. The two maps show results from simulations using different 3-D Earth structure models. The Earth model that produced the best overall match to observations (shown here on the left) was the model used as input for the team's recent 1 hertz CyberShake seismic hazard simulation on the Blue Waters supercomputer.
Credit: Ricardo Taborda, University of Memphis, and Jacobo Bielak, Carnegie Mellon University
Images credited to the National Science Foundation, a federal agency, are in the public domain. The images were created by employees of the United States Government as part of their official duties or prepared by contractors as "works for hire" for NSF. You may freely use NSF-credited images and, at your discretion, credit NSF with a "Courtesy: National Science Foundation" notation.
Additional information about general usage can be found in Conditions.
Also Available:
Download the high-resolution JPG version of the image. (89.7 KB)
Use your mouse to right-click (Mac users may need to Ctrl-click) the link above and choose the option that will save the file or target to your computer.
Related story: Los Angeles basin jiggles like big bowl of jelly in cutting-edge simulations