
Multimedia Gallery
Oil Reservoir Simulations (Image 9)
Oil Reservoir Simulations (Image 9)
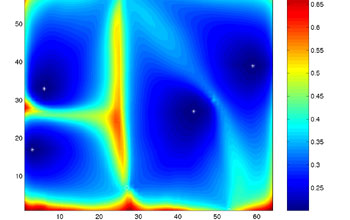
Visualizations of oil reservoir simulations at various stages in an optimization. Pumps, represented by asterisks, push oil toward wells, represented by small white circles that draw oil from the ground. Blue areas indicate areas of high water concentration. Brown areas indicate areas of high oil concentration. By the end of the simulations, there is not much oil left in the reservoir and what is left has been swept toward the wells.
More about this Image
In oil production management, it is often important to "squeeze" as much oil out of a reservoir as possible. In practice, this is often done by injecting water, gas or other fluids into the reservoir through some wells, while pumping oil out through others. The injection is used to keep the reservoir pressure high, to drive the oil from the injection wells to the production wells, or to modify the viscosity of oil to make it flow more easily.
The problem with this is that one often doesn't know where the best places for injection and production wells are. Numerical simulation can help to optimize their placement. In this sequence of pictures for an imaginary oil reservoir, we start with a naive placement of wells (stars indicate injection, circles production wells) and simulate how oil flows under these conditions. The pictures show the pattern of oil saturation at the end of the projected life time of the reservoir. As seen in the early images, the oil (brown) is displaced by the injected water (blue) and pushed towards production wells, but a significant amount of oil remains at the end in the reservoir, mainly around the rim of the reservoir.
In subsequent steps, an algorithm called SPSA (for Simultaneous Perturbation Stochastic Approximation) moves wells around in the reservoir and tries to find locations that allow for a better exploitation of the oil. As iterations proceed, it becomes obvious that more and more of the oil can be produced by better and better placement of injector and producer wells. In the final images, almost all of the oil is swept out of the reservoir at the end of its projected lifetime. The pattern of wells found using this automatic process here resembles a pattern often used heuristically used by oil field engineers, called a "line drive" pattern, in which injector wells are aligned in a line (roughly a horizontal line in the images), driving the oil towards producer wells that are also located in lines, here the bottom and top boundaries of the reservoir.
This research was performed at the University of Texas at Austin's Center for Subsurface Modeling with support from National Science Foundation grant CNS 04-27005. (Date of Image: March 2005) [One of 11 related images. See Next Image.]
Credit: Wolfgang Bangerth, Hector Klie, Mary Wheeler, Mrinal Sen, Paul Stoffa and Xiuli Gai; NCSA
Images and other media in the National Science Foundation Multimedia Gallery are available for use in print and electronic material by NSF employees, members of the media, university staff, teachers and the general public. All media in the gallery are intended for personal, educational and nonprofit/non-commercial use only.
Images credited to the National Science Foundation, a federal agency, are in the public domain. The images were created by employees of the United States Government as part of their official duties or prepared by contractors as "works for hire" for NSF. You may freely use NSF-credited images and, at your discretion, credit NSF with a "Courtesy: National Science Foundation" notation.
Additional information about general usage can be found in Conditions.
Also Available:
Download the high-resolution JPG version of the image. (533 KB)
Use your mouse to right-click (Mac users may need to Ctrl-click) the link above and choose the option that will save the file or target to your computer.